Purchasing a home is one of the most important investments there is. More than a place to live, homeownership is an asset with the potential to tremendously rise in value. Given the current state of the real estate market, housing affordability plays a determining role for buyers. As of May 4, 2022, the 30-year fixed mortgage rate sits at 5.73%. As a result of higher mortgage rates across the board, home prices have risen significantly. According to the National Association of Realtors, the national median home price is $375,300—up from just over $356,000 this time last year.
Although home prices have inflated all across the U.S., there are definitely certain areas that have a higher price tag than others. Location, size, age, and condition are all contributing factors to home value. Whether you choose to hold off your home-buying plans in hopes of the market cooling down or are looking to buy ASAP, it’s good to educate yourself on the market in different cities.
Stacker compiled a list of cities with the most expensive homes in Los Angeles using data from Zillow. Cities are ranked by the Zillow Home Values Index for all homes as of March 2022. Cities with at least three years of historical data were included. The charts in this story were created automatically using Matplotlib.
You may also like: Where people in Los Angeles are moving to most
1 / 30Stacker
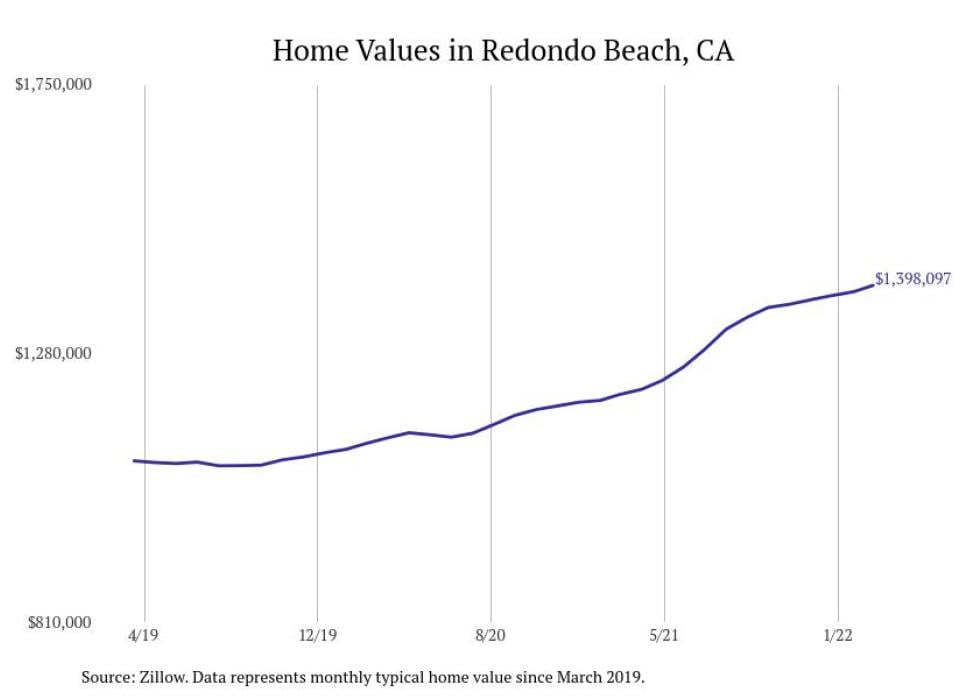
#30. Redondo Beach, CA
– Typical home value: $1,421,789
– 1-year price change: +16.9%
– 5-year price change: +44.0%
2 / 30Stacker
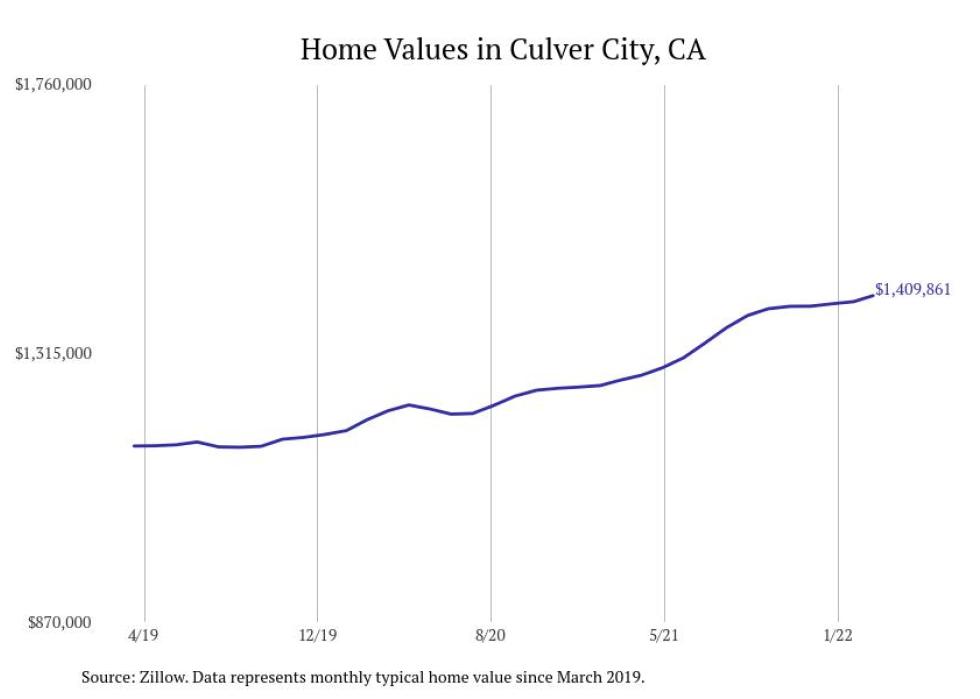
#29. Culver City, CA
– Typical home value: $1,432,744
– 1-year price change: +12.1%
– 5-year price change: +44.5%
3 / 30Stacker
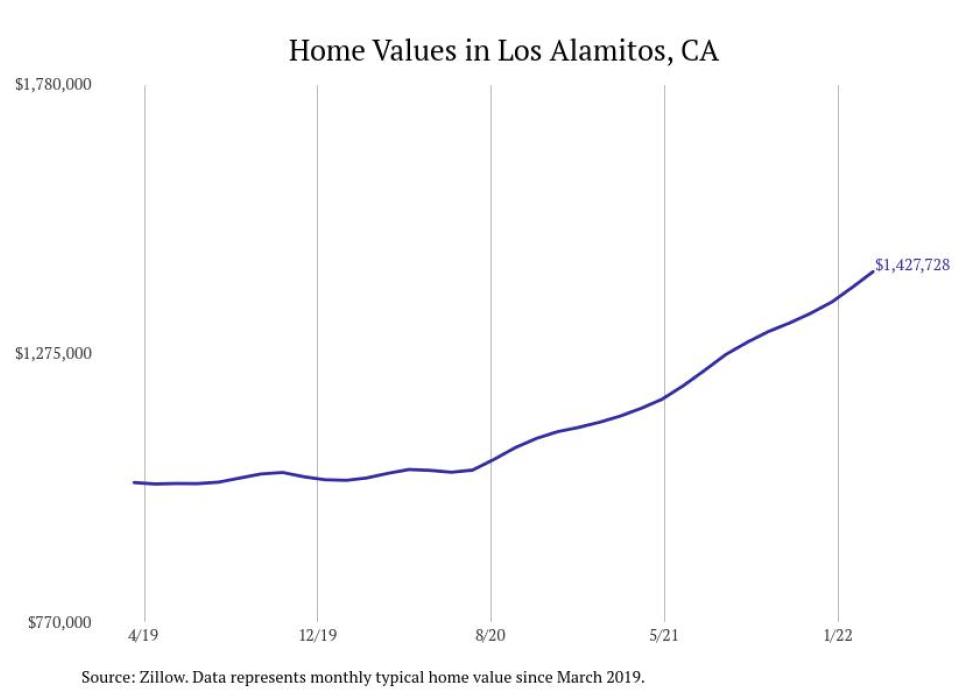
#28. Los Alamitos, CA
– Typical home value: $1,458,003
– 1-year price change: +24.5%
– 5-year price change: +56.6%https://2d2b91744fe82ba6f289c602e82fded7.safeframe.googlesyndication.com/safeframe/1-0-38/html/container.html
4 / 30Stacker
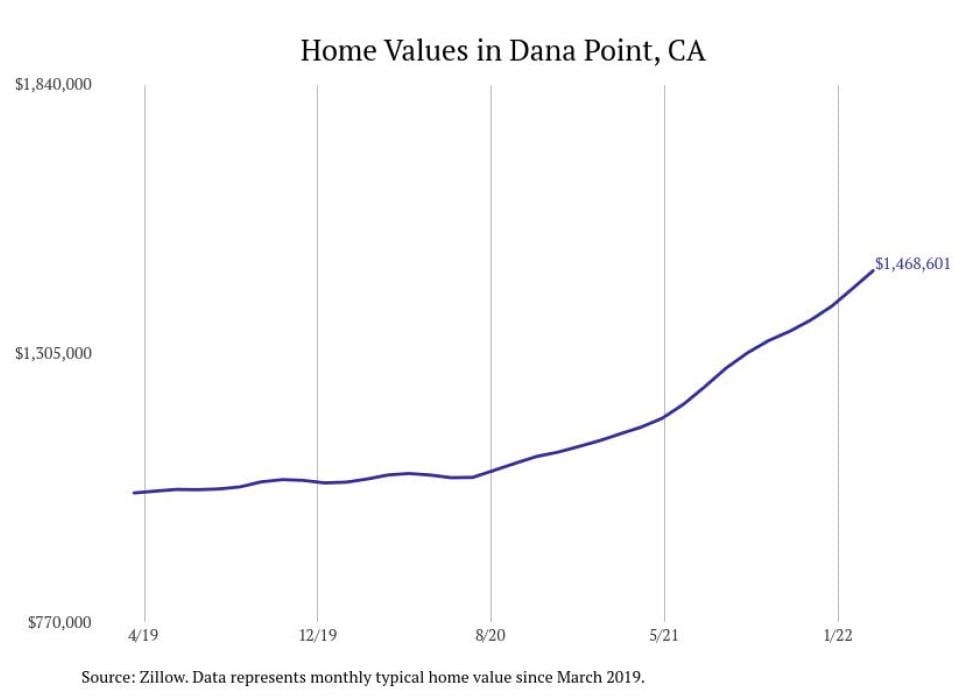
#27. Dana Point, CA
– Typical home value: $1,506,701
– 1-year price change: +30.1%
– 5-year price change: +54.4%
5 / 30Stacker
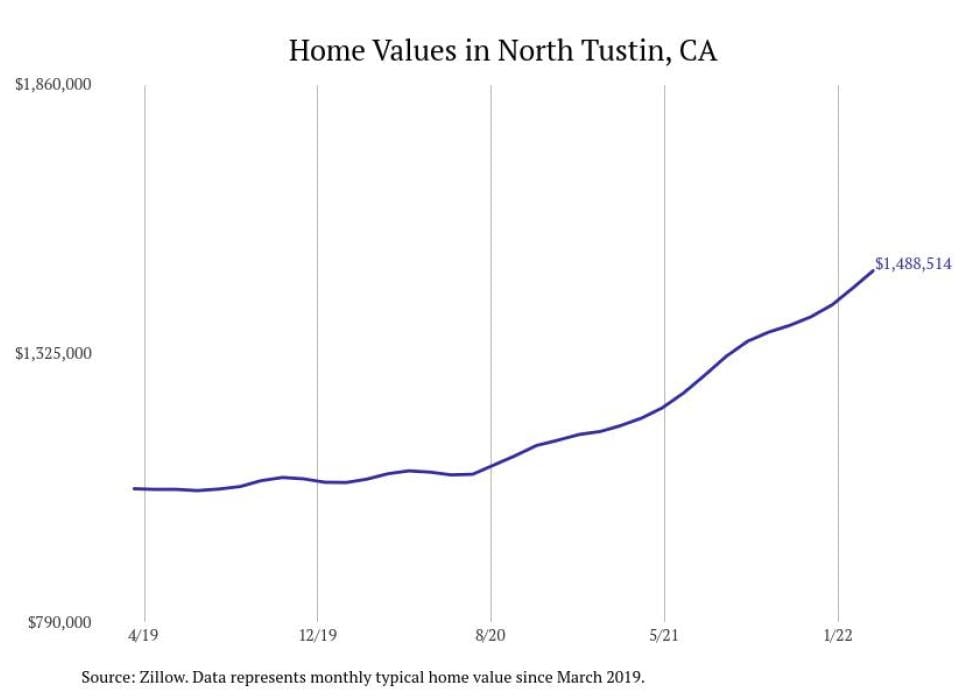
#26. North Tustin, CA
– Typical home value: $1,528,036
– 1-year price change: +27.8%
– 5-year price change: +54.8%
You may also like: Highest-rated dessert shops in Los Angeles, according to Tripadvisor
6 / 30Stacker
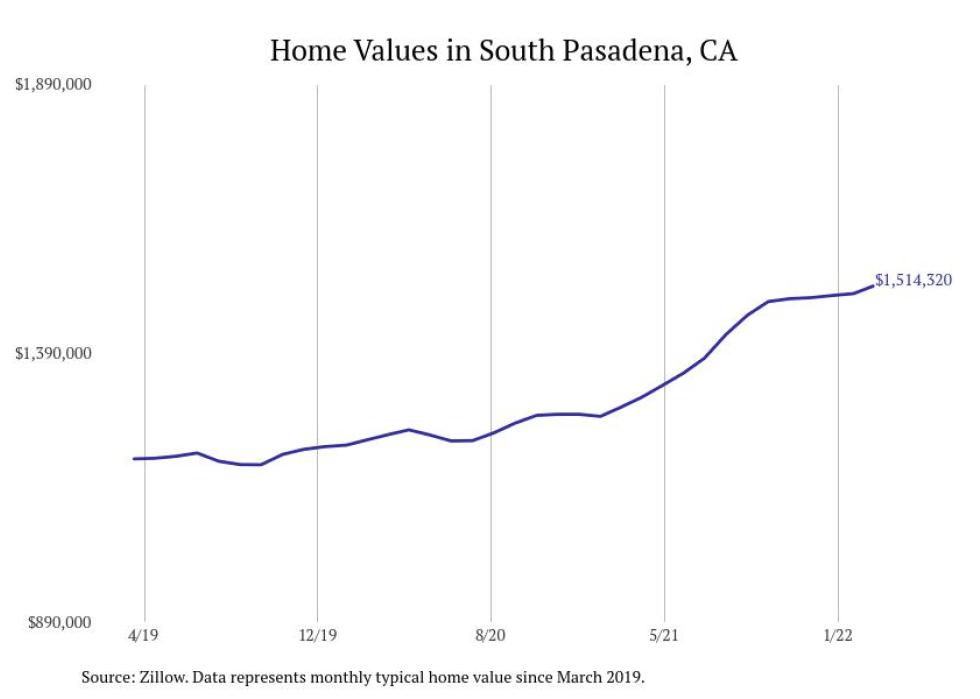
#25. South Pasadena, CA
– Typical home value: $1,537,990
– 1-year price change: +17.6%
– 5-year price change: +40.4%
7 / 30Stacker
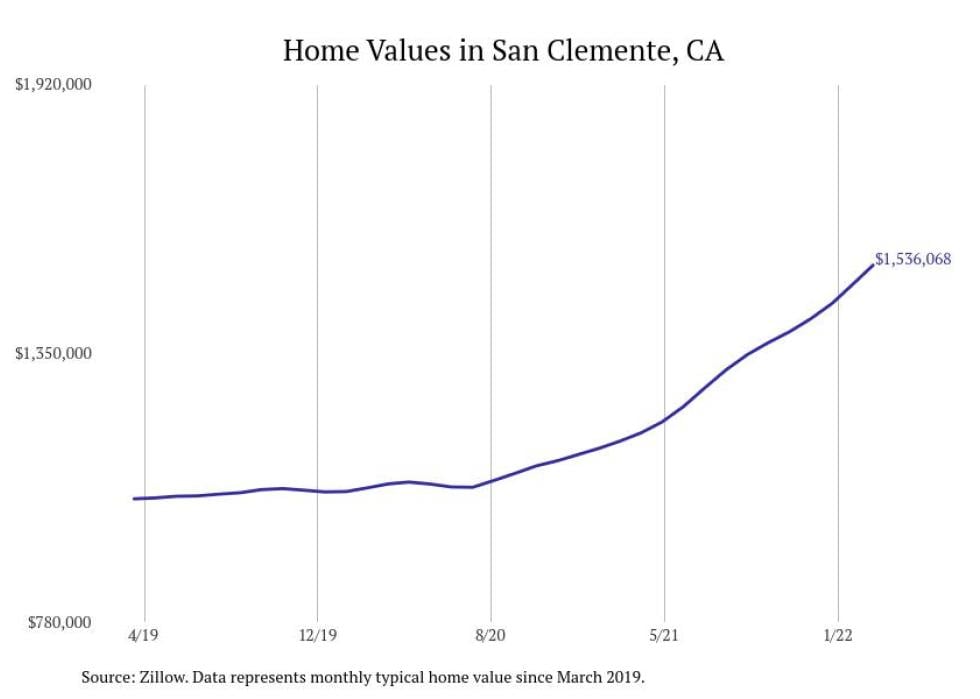
#24. San Clemente, CA
– Typical home value: $1,579,520
– 1-year price change: +33.7%
– 5-year price change: +61.5%
8 / 30Stacker
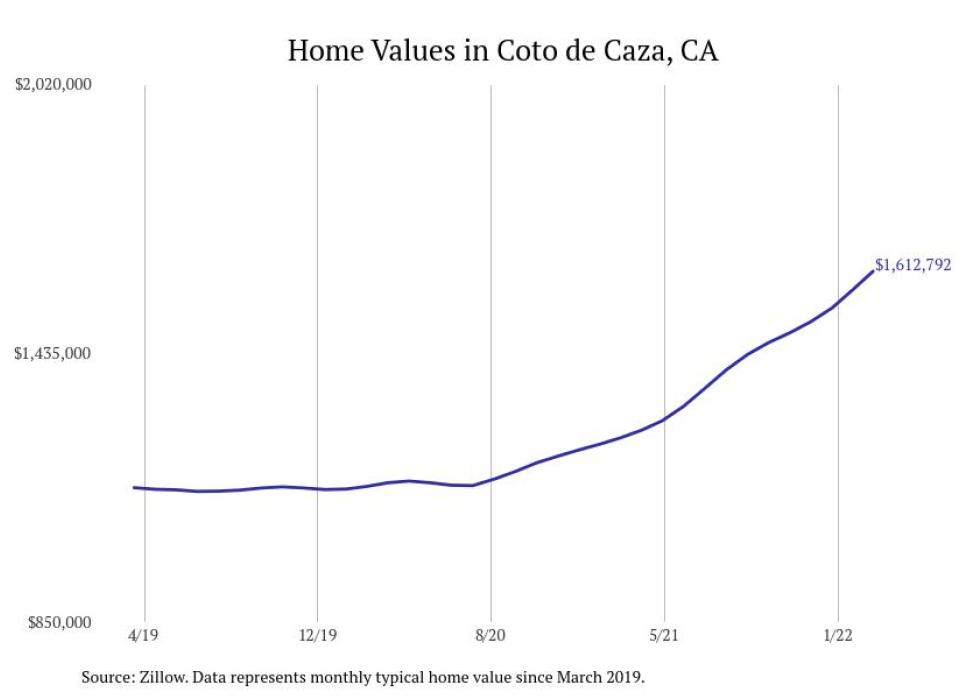
#23. Coto de Caza, CA
– Typical home value: $1,656,389
– 1-year price change: +30.7%
– 5-year price change: +51.5%
9 / 30Stacker
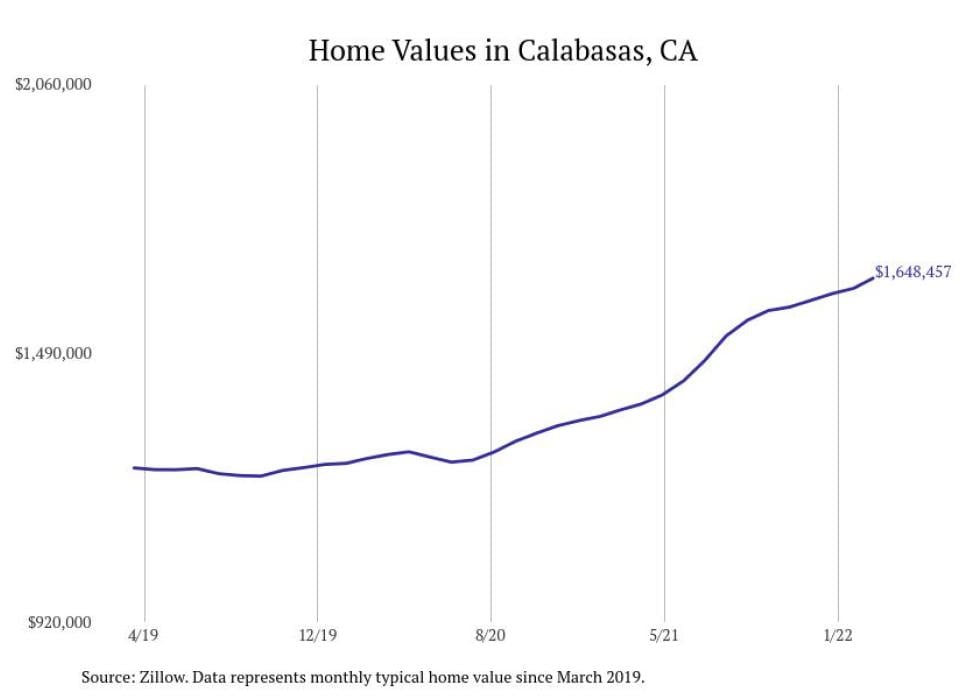
#22. Calabasas, CA
– Typical home value: $1,685,806
– 1-year price change: +22.0%
– 5-year price change: +44.5%https://2d2b91744fe82ba6f289c602e82fded7.safeframe.googlesyndication.com/safeframe/1-0-38/html/container.html
10 / 30Stacker
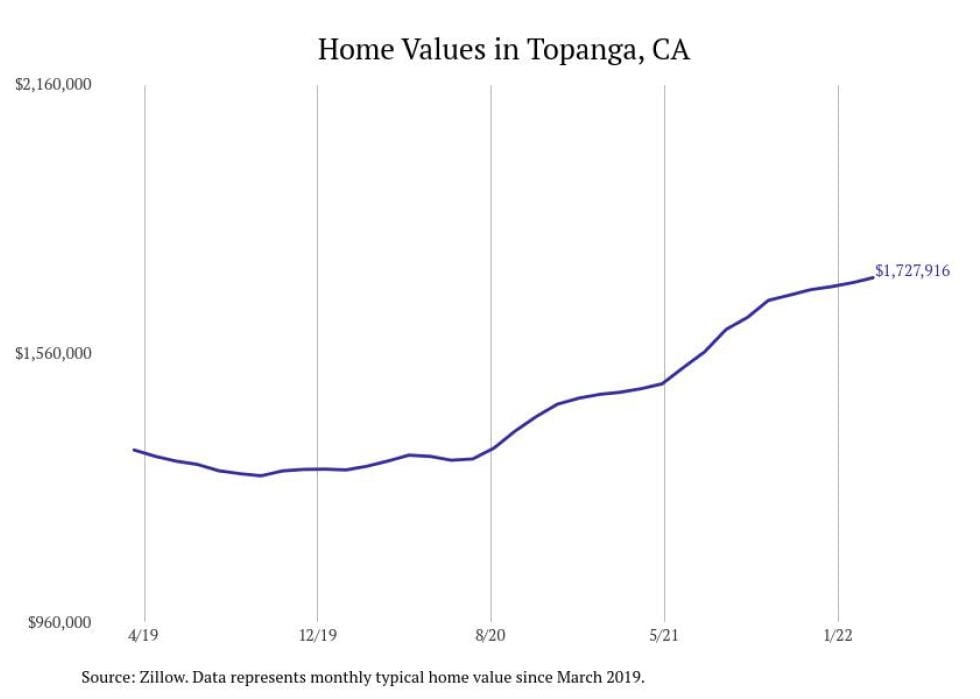
#21. Topanga, CA
– Typical home value: $1,746,531
– 1-year price change: +18.0%
– 5-year price change: +43.1%
You may also like: Highest-rated Asian restaurants in Los Angeles, according to Tripadvisor

11 / 30Stacker
#20. Ladera Heights, CA
– Typical home value: $1,784,752
– 1-year price change: +14.8%
– 5-year price change: +69.3%
12 / 30Stacker
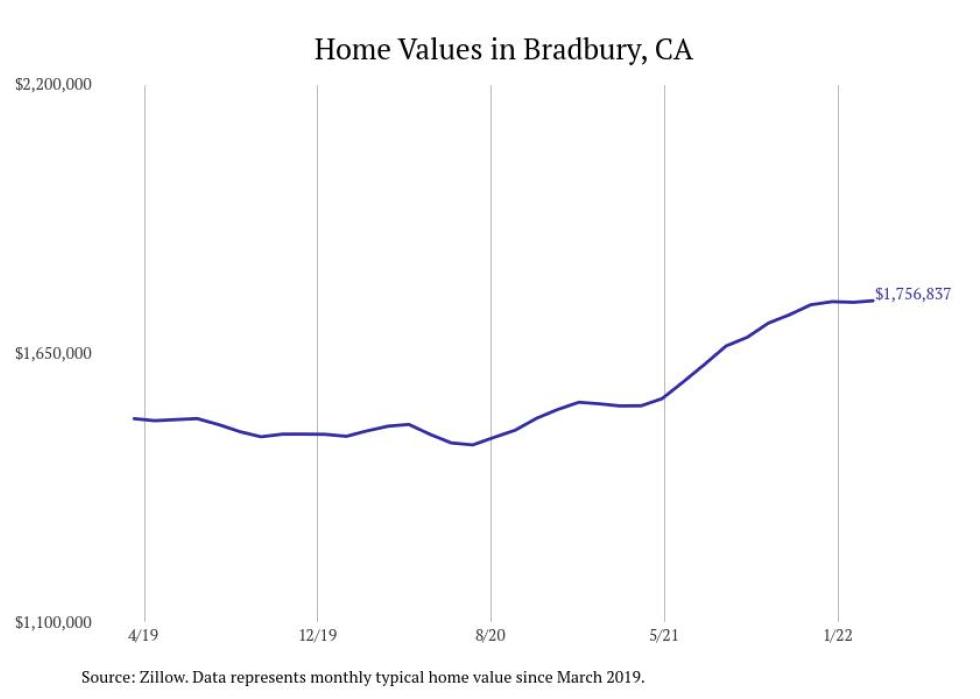
#19. Bradbury, CA
– Typical home value: $1,787,401
– 1-year price change: +15.9%
– 5-year price change: +17.8%
13 / 30Stacker
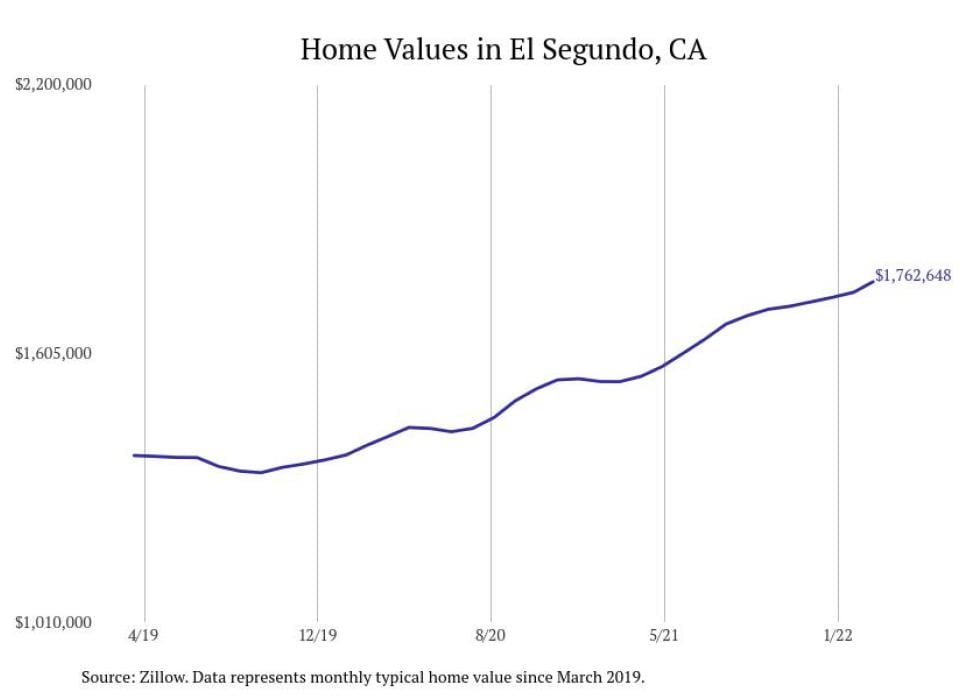
#18. El Segundo, CA
– Typical home value: $1,799,299
– 1-year price change: +15.8%
– 5-year price change: +41.4%
14 / 30Stacker
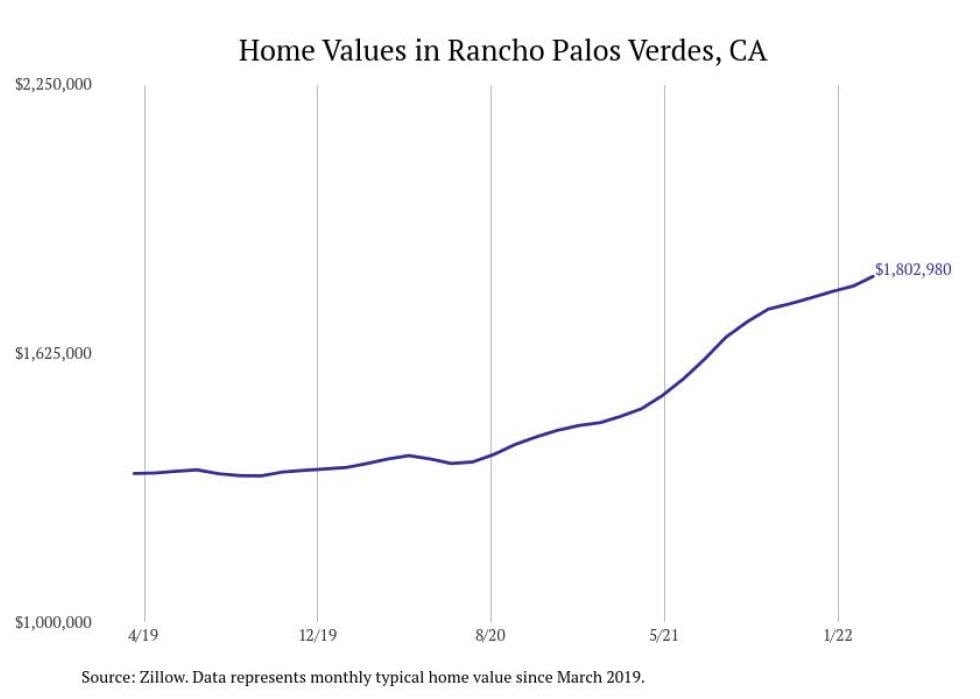
#17. Rancho Palos Verdes, CA
– Typical home value: $1,836,107
– 1-year price change: +22.8%
– 5-year price change: +43.8%
15 / 30Stacker
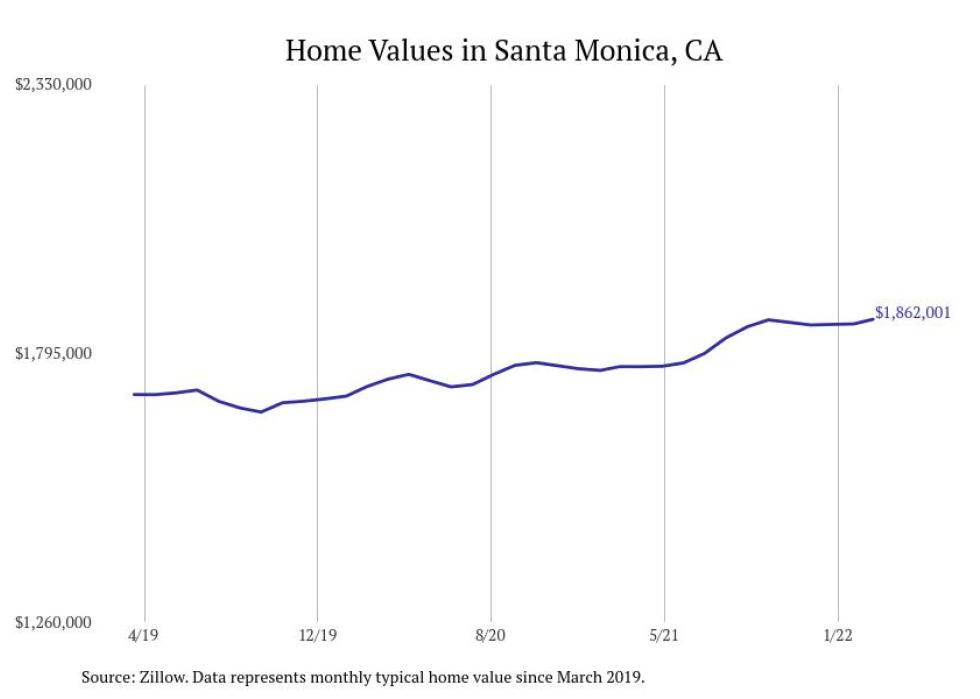
#16. Santa Monica, CA
– Typical home value: $1,887,028
– 1-year price change: +6.7%
– 5-year price change: +18.6%
You may also like: Highest-rated brunch restaurants in Los Angeles, according to Tripadvisor
16 / 30Stacker
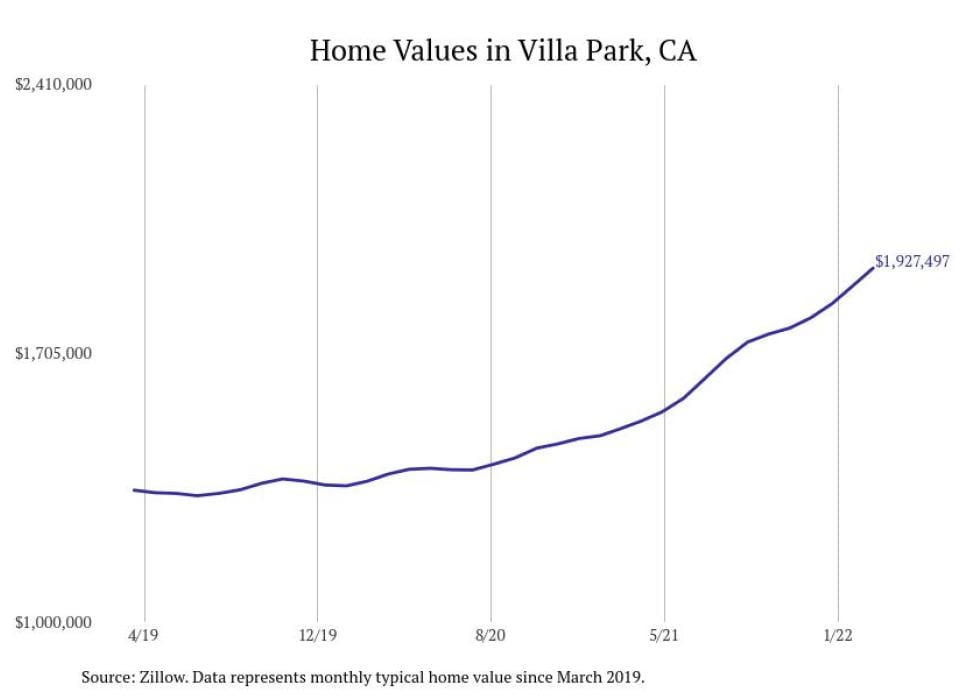
#15. Villa Park, CA
– Typical home value: $1,977,592
– 1-year price change: +29.5%
– 5-year price change: +52.7%
17 / 30Stacker
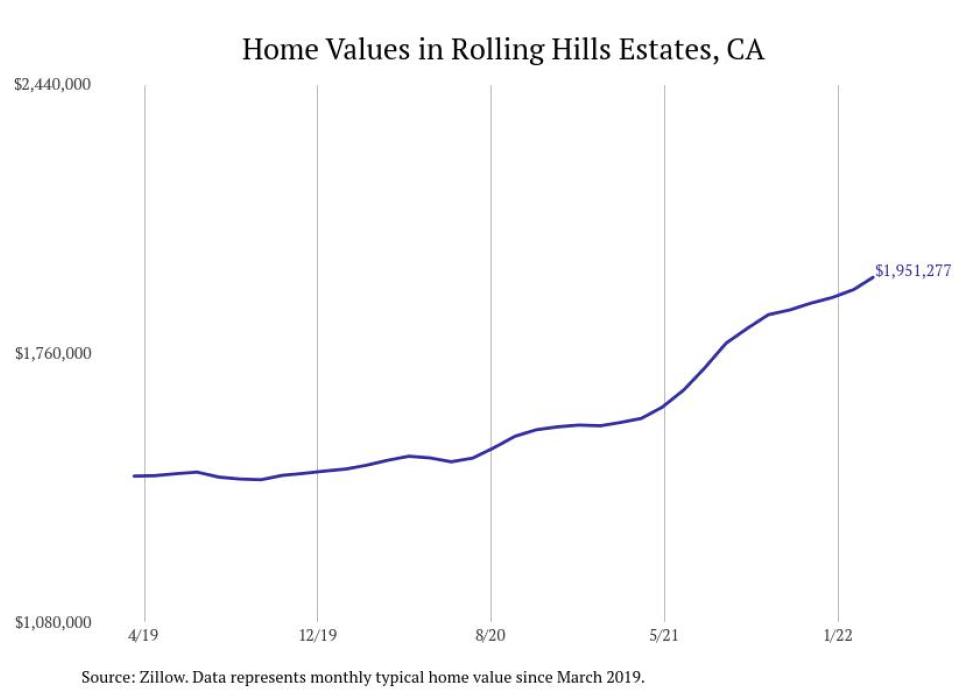
#14. Rolling Hills Estates, CA
– Typical home value: $2,000,240
– 1-year price change: +25.4%
– 5-year price change: +42.7%
18 / 30Stacker
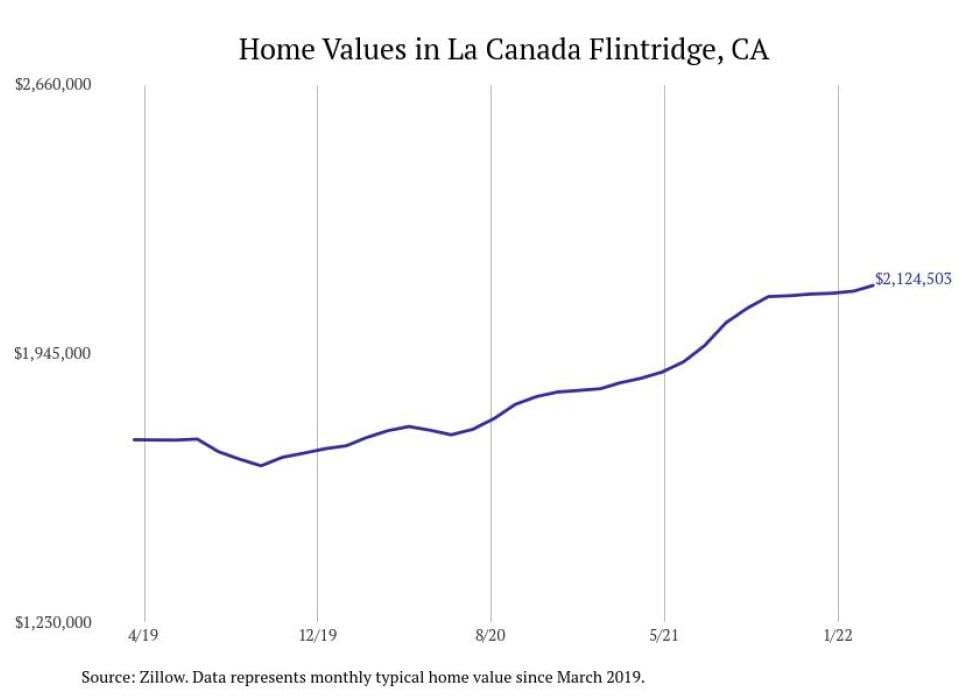
#13. La Canada Flintridge, CA
– Typical home value: $2,160,586
– 1-year price change: +15.0%
– 5-year price change: +32.1%https://2d2b91744fe82ba6f289c602e82fded7.safeframe.googlesyndication.com/safeframe/1-0-38/html/container.html
19 / 30Stacker
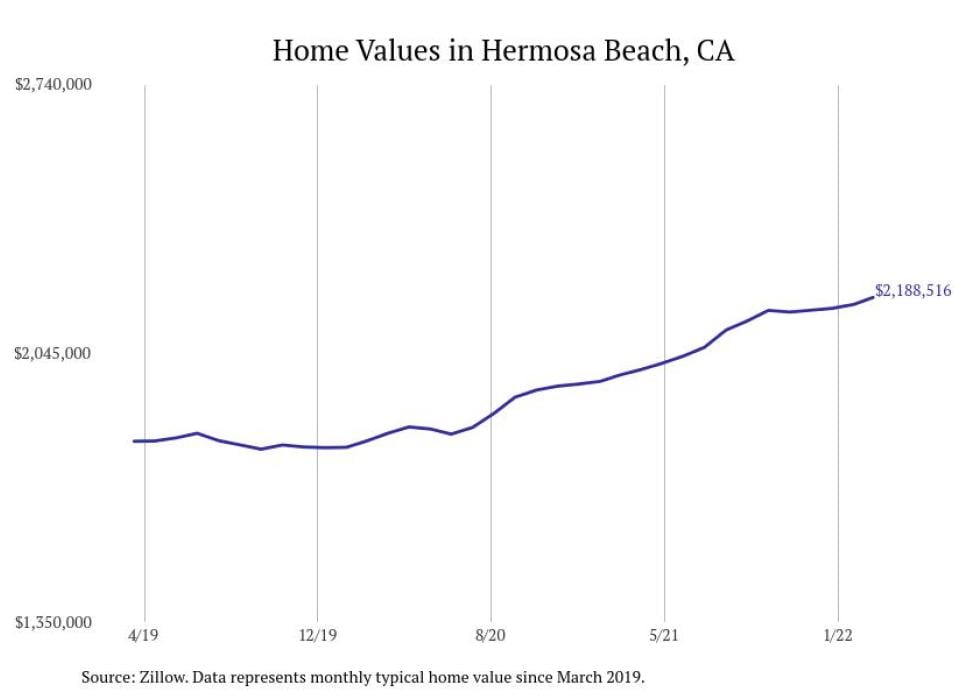
#12. Hermosa Beach, CA
– Typical home value: $2,220,007
– 1-year price change: +10.9%
– 5-year price change: +27.4%
20 / 30Stacker
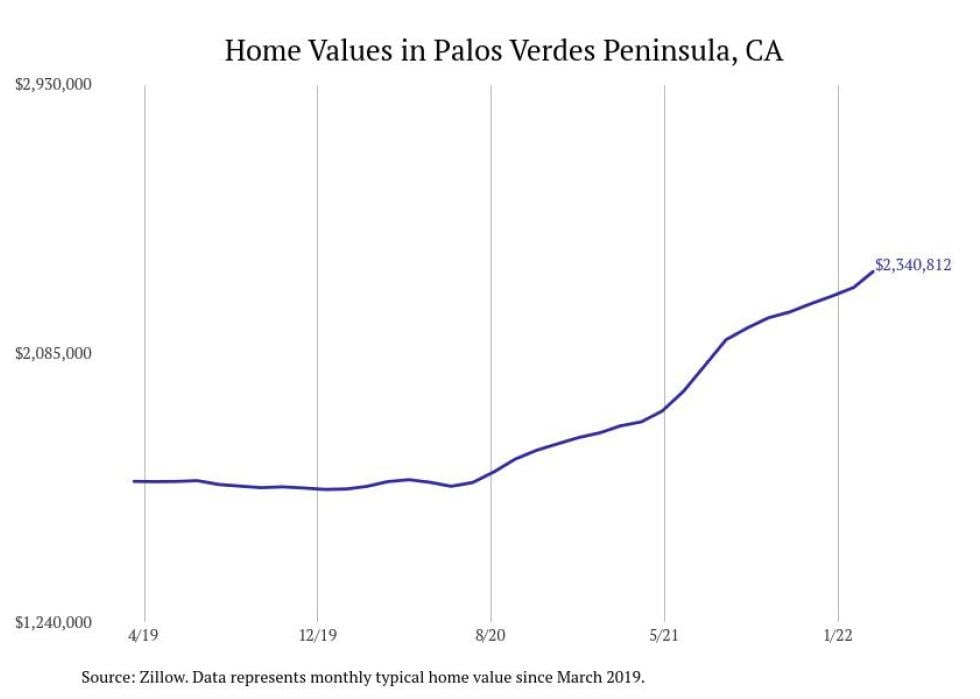
#11. Palos Verdes Peninsula, CA
– Typical home value: $2,402,370
– 1-year price change: +28.5%
– 5-year price change: +50.1%
You may also like: Highest and lowest paying health care jobs in Los Angeles
21 / 30Stacker
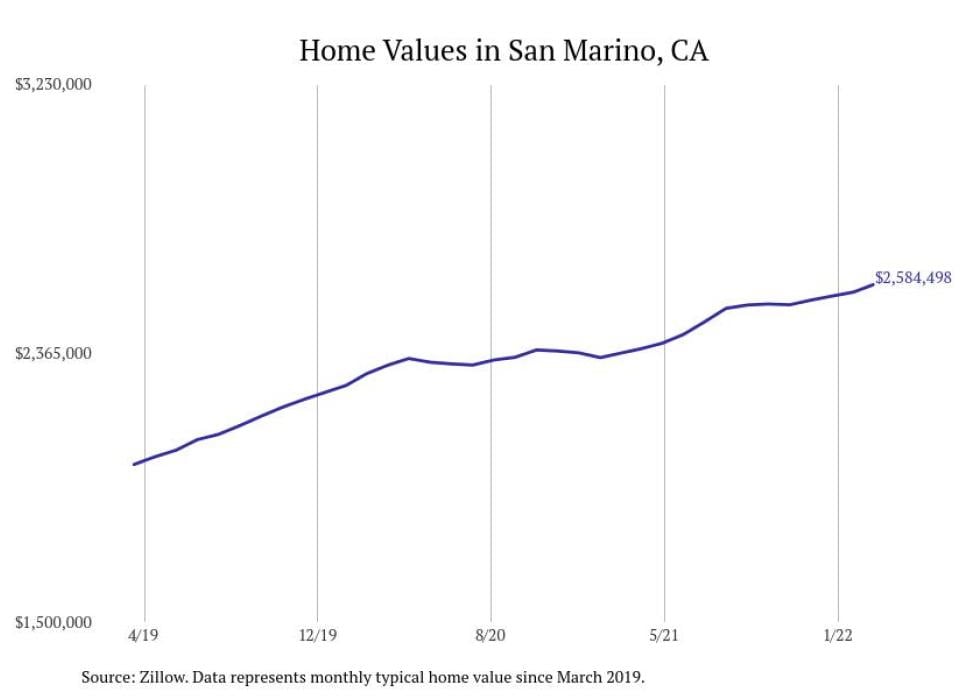
#10. San Marino, CA
– Typical home value: $2,636,603
– 1-year price change: +10.8%
– 5-year price change: +72.7%https://2d2b91744fe82ba6f289c602e82fded7.safeframe.googlesyndication.com/safeframe/1-0-38/html/container.html
22 / 30Stacker
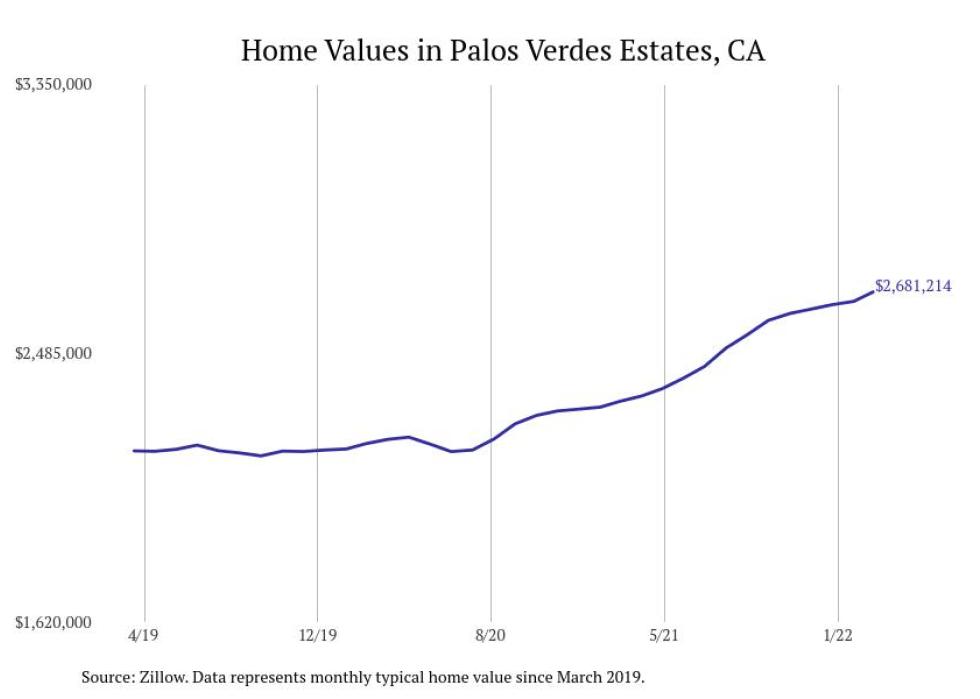
#9. Palos Verdes Estates, CA
– Typical home value: $2,731,929
– 1-year price change: +16.4%
– 5-year price change: +30.1%
23 / 30Stacker
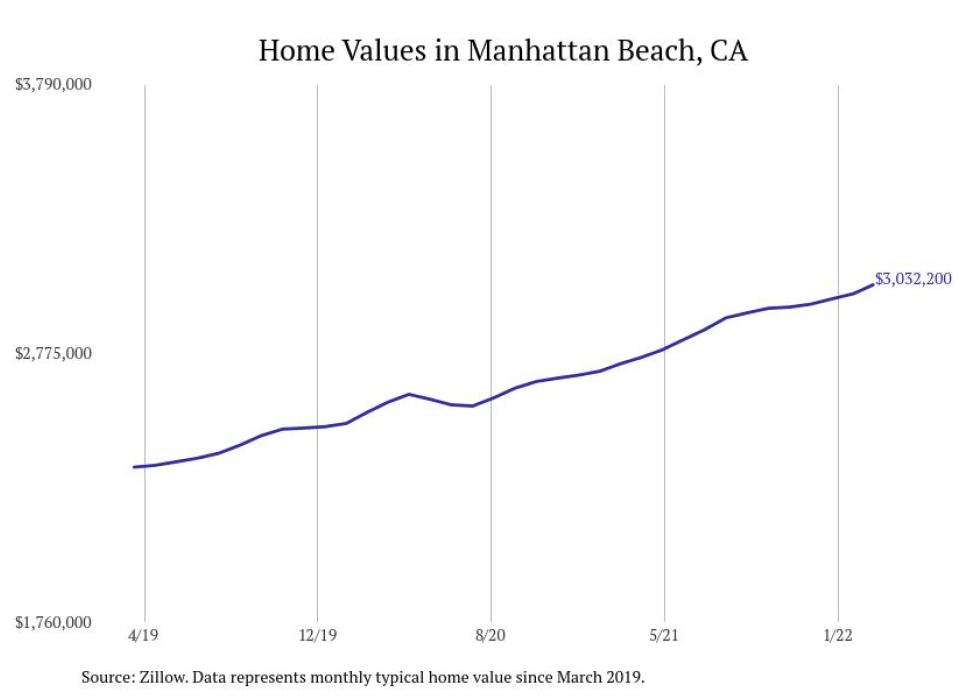
#8. Manhattan Beach, CA
– Typical home value: $3,083,225
– 1-year price change: +11.8%
– 5-year price change: +40.3%
24 / 30Stacker
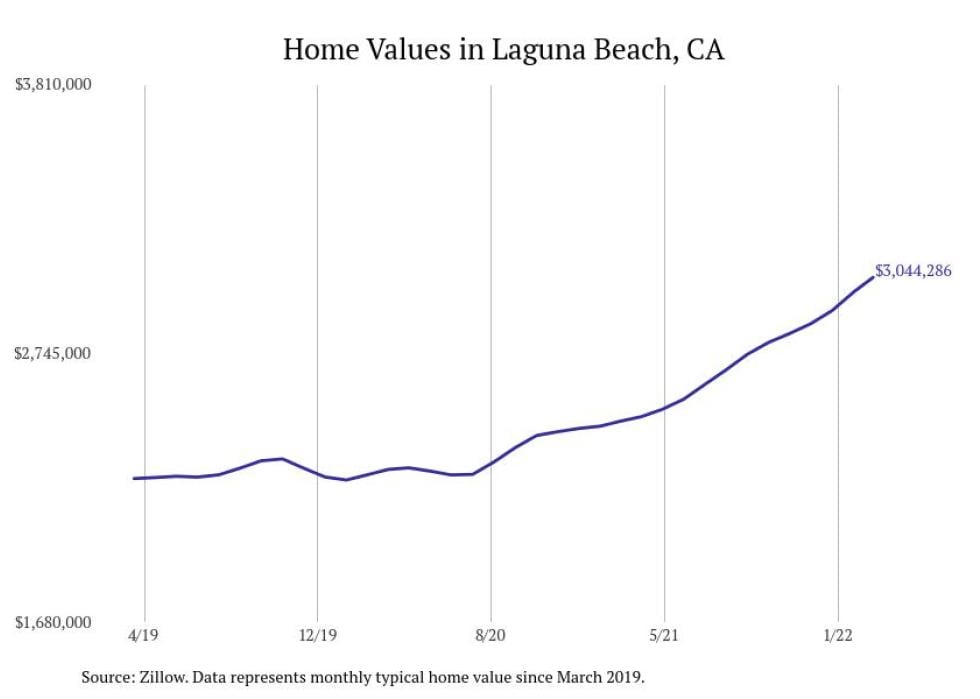
#7. Laguna Beach, CA
– Typical home value: $3,102,992
– 1-year price change: +24.5%
– 5-year price change: +38.6%https://2d2b91744fe82ba6f289c602e82fded7.safeframe.googlesyndication.com/safeframe/1-0-38/html/container.html
25 / 30Stacker
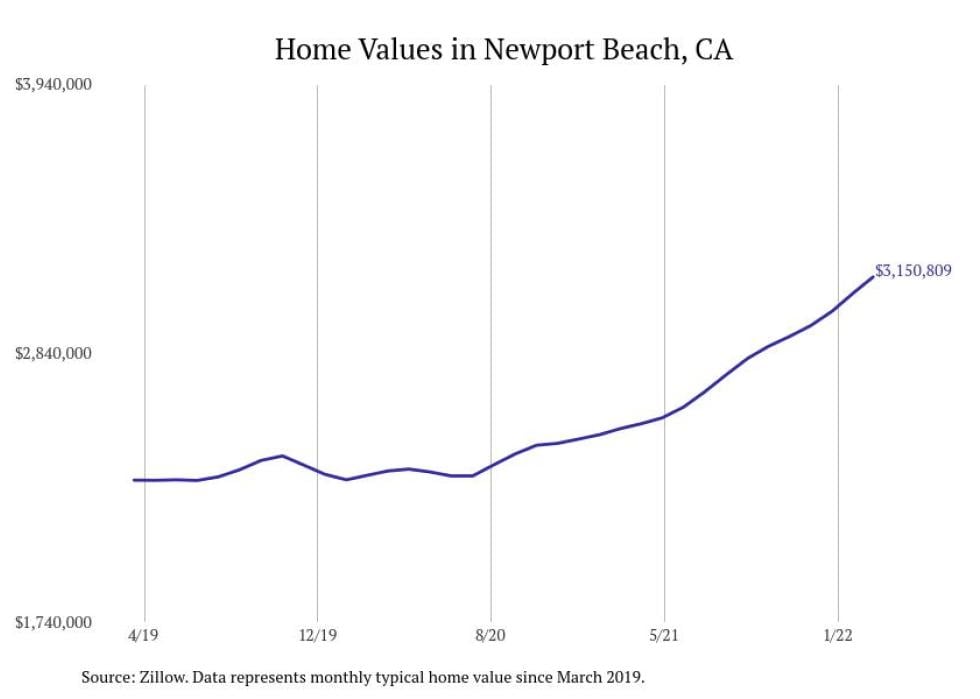
#6. Newport Beach, CA
– Typical home value: $3,220,479
– 1-year price change: +26.2%
– 5-year price change: +43.6%
You may also like: How gas prices have changed in Los Angeles in the last week
26 / 30Stacker
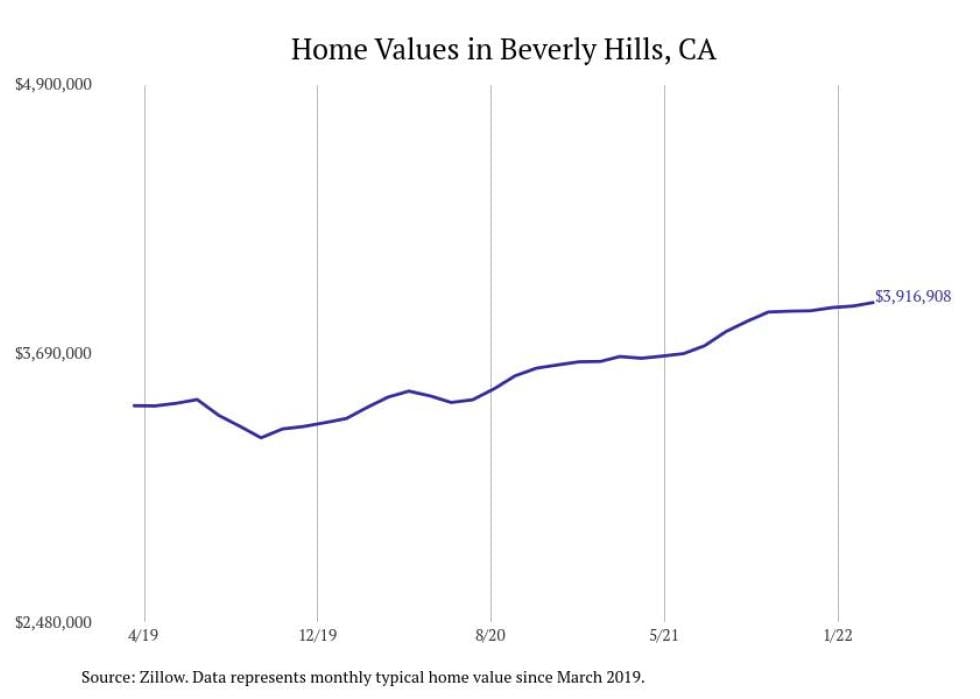
#5. Beverly Hills, CA
– Typical home value: $3,955,849
– 1-year price change: +7.9%
– 5-year price change: +19.1%
27 / 30Stacker
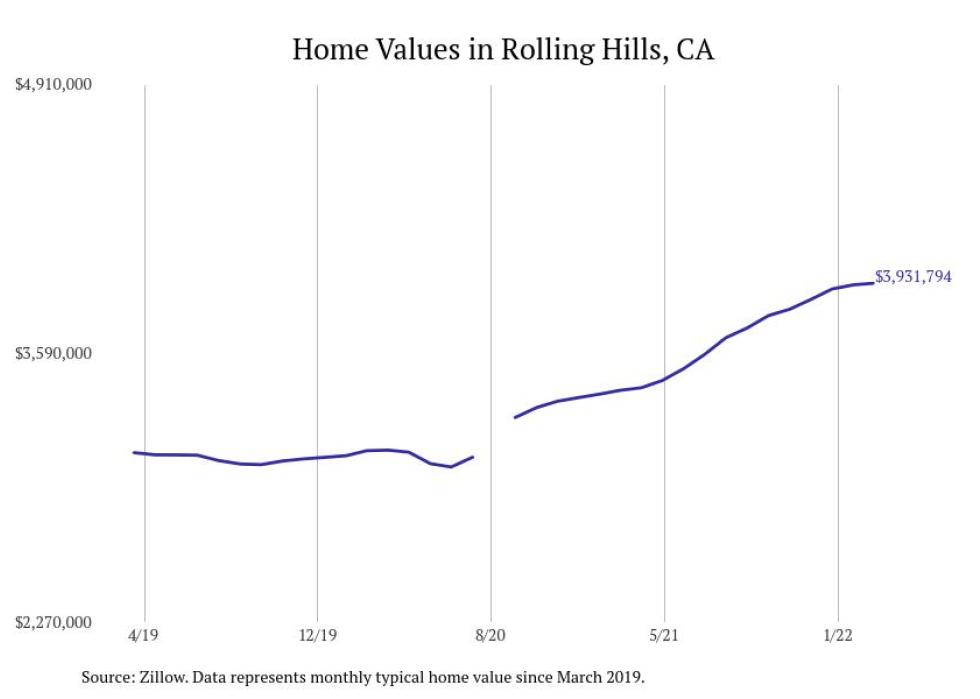
#4. Rolling Hills, CA
– Typical home value: $3,965,828
– 1-year price change: +16.0%
– 5-year price change: +26.8%https://2d2b91744fe82ba6f289c602e82fded7.safeframe.googlesyndication.com/safeframe/1-0-38/html/container.html
28 / 30Stacker
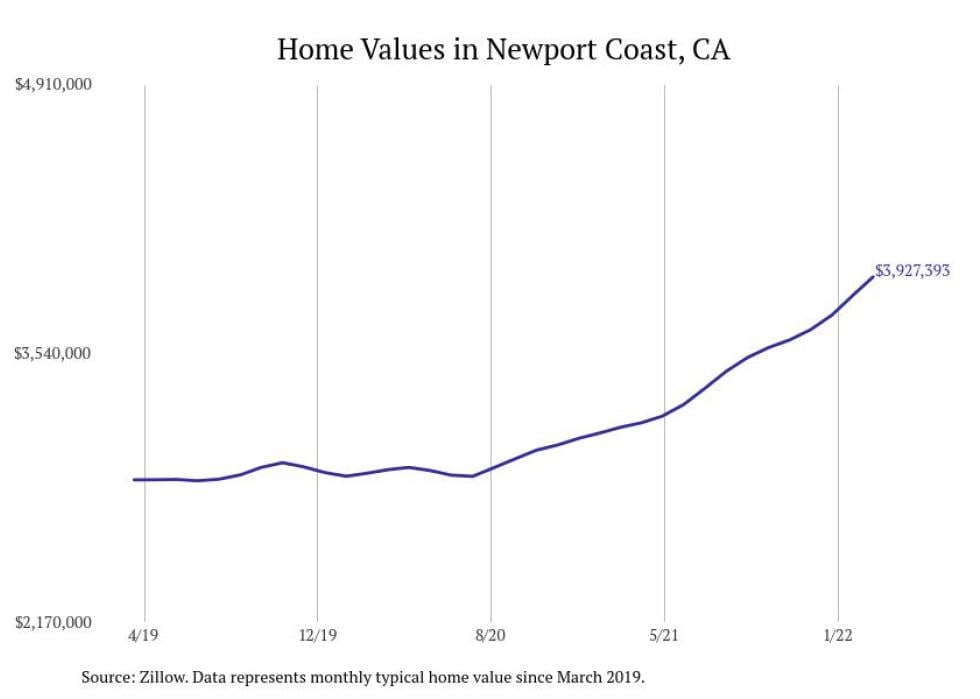
#3. Newport Coast, CA
– Typical home value: $4,022,560
– 1-year price change: +26.3%
– 5-year price change: +40.9%
29 / 30Stacker
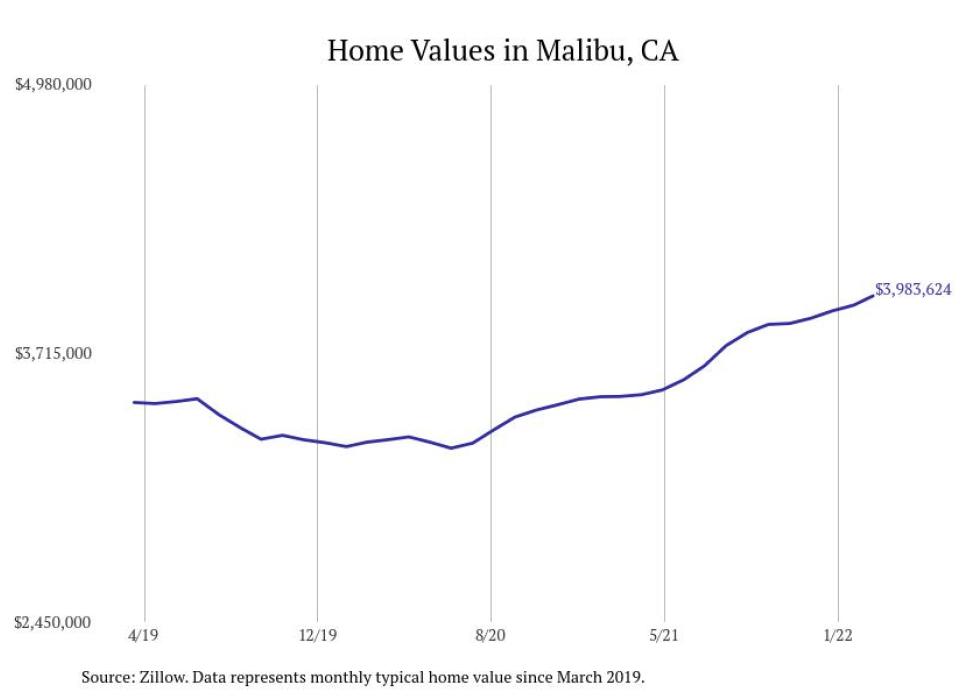
#2. Malibu, CA
– Typical home value: $4,046,547
– 1-year price change: +15.0%
– 5-year price change: +19.8%
30 / 30Stacker
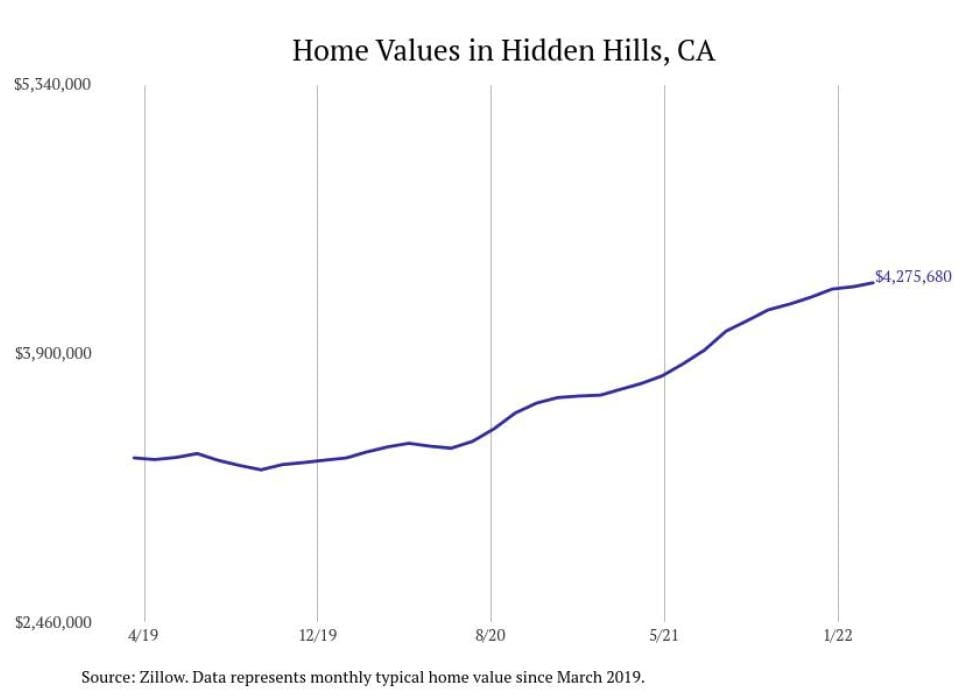
#1. Hidden Hills, CA
– Typical home value: $4,325,601
– 1-year price change: +15.8%
– 5-year price change: +30.0%