The American Lung Association has released its annual ‘State of the Air’ report, and the news isn’t good for California.
Golden State cities swept the top spots in all three pollution categories: ozone, year-round particulate matter (PM), and short-term particulate matter – all of which come largely from man-made sources like vehicles, factories and refineries.
Natural sources include forest fires and volcanoes.
The Los Angeles-Long Beach metro area ranked #1 again with the most high ozone days of the 227 metropolitan areas that were included. Bakersfield was #1 in both year-round and short-term particulate pollution (aka. smog).
Sacramento, Fresno and Visalia also landed in the top 10 in each category.
The data used to create the rankings came from official monitoring sites across the nation and shows 119.6 million Americans -nearly 36% of the population- live in places with failing marks.
But the news isn’t all bad.
“Overall, this is 17.6 million fewer people breathing unhealthy air compared to last year’s report,” the Lung Association said. “The improvement was seen in falling levels of ozone in many places around the country, the continuation of a positive trend that reflects the success of the Clean Air Act.”
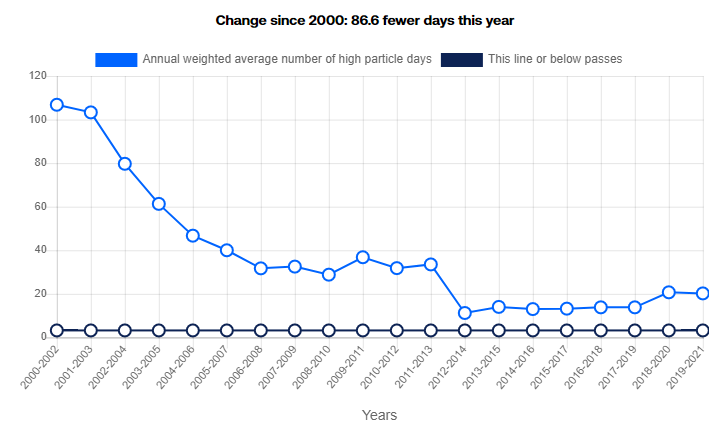
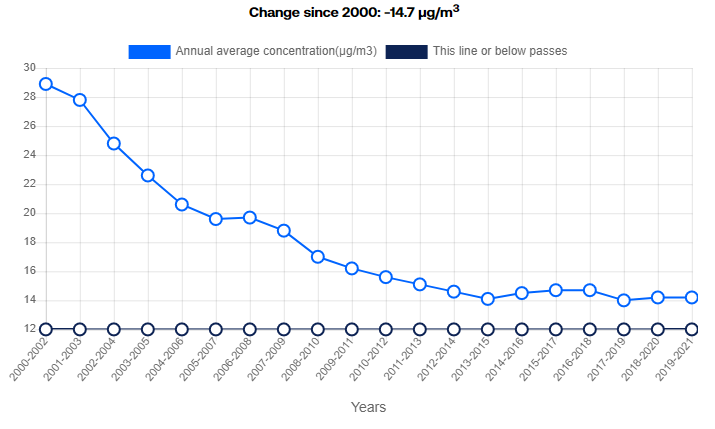
Metro L.A. has seen the number of high particulate days and the overall concentration of airborne particulates decline significantly since 2000. The number of high ozone days has also dropped, but to a lesser degree.
Air pollution has been linked to increased rates of cancer, cardiovascular disease and respiratory illness.
So why is California so disproportionately represented on these lists? Researchers point to several geographic factors – and global warming.
“The impact of climate change in the West has meant higher temperatures, dry, sunny skies and more frequent stagnation events that are contributing to the number of unhealthy ozone days being higher than it would otherwise be,” the study’s authors said. “Simply, climate change is undercutting the progress we would have made.”
American Lung Association Top 10 Rankings
Ozone Pollution
#1: Los Angeles-Long Beach, CA
#2: Visalia, CA
#3: Bakersfield, CA
#4: Fresno-Madera-Hanford, CA
#5: Phoenix-Mesa, AZ
#6: Denver-Aurora, CO
#7: Sacramento-Roseville, CA
#8: San Diego-Chula Vista-Carlsbad, CA
#9: Houston-The Woodlands, TX
#10: Salt Lake City-Provo-Orem, UT
By Year Round Particle Pollution
#1: Bakersfield, CA
#1: Visalia, CA
#3: Fresno-Madera-Hanford, CA
#4: Los Angeles-Long Beach, CA
#5: Fairbanks, AK
#6: Sacramento-Roseville, CA
#7: Medford-Grants Pass, OR
#7: Phoenix-Mesa, AZ
#7: San Jose-San Francisco-Oakland, CA
#10: Indianapolis-Carmel-Muncie, IN
By Short-Term Particle Pollution
#1: Bakersfield, CA
#2: Fresno-Madera-Hanford, CA
#3: Fairbanks, AK
#4: Visalia, CA
#5: Reno-Carson City-Fernley, NV
#6: San Jose-San Francisco-Oakland, CA
#7: Redding-Red Bluff, CA
#8: Sacramento-Roseville, CA
#9: Chico, CA
#9: Los Angeles-Long Beach, CA